This project is the Stage 1 for my Smart Trashbin Project Series. Check out OmniRecycle for Stage 2.
Background:
Waste generation is a major global concern. Yearly 2.2 billion tons of waste is generated worldwide. That is equivalent to every person generating 2 kgs of waste every day. Unfortunately, only 10% of that waste is recycled and most of the un-recycled waste gets dumped in landfills or incinerated, both of which lead to environmental problems. The main reason behind waste not being recycled is the lack of knowledge in people to classify waste.
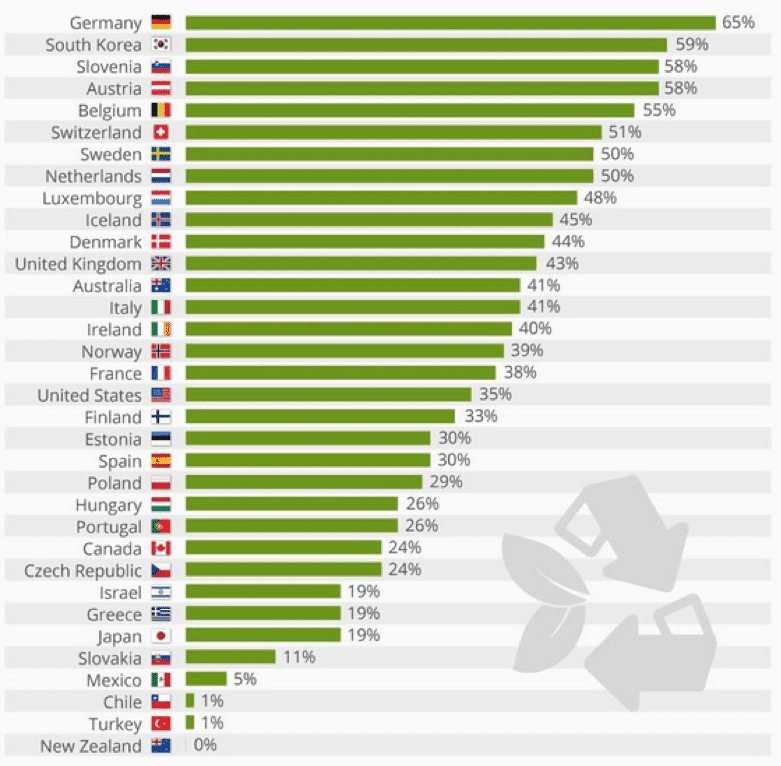
On the brighter side, there is a potential for recycling over 70% of the waste generated. Countries like Germany, South Korea and Austria recycle over 65%, 59% and 58% of their waste respectively. So it is practically possible to recycle waste.
Current drawbacks:
The first step in waste recycling is to sort the waste properly. This involves being able to distinguish the different waste categories and classify them accordingly. But not many people are aware of this knowledge and end up dumping all the waste under one category. And the municipal authorities which collect this waste cannot completely sort the waste as it is very laborious and time-consuming. And to be frank, not many people are willing to do this dirty work.
Secondly, companies, especially small businesses, do not want to spend extra time and effort to segregate waste as this is a non-value adding process, strictly speaking in terms of finance. And current regulation cannot does not have the capacity to strictly enforce recycling or monitor the process. For businesses recycling is a social responsibility instead of an obligation.
Thirdly, it requires tremendous labor for the recycling facility to do off-site recycling: they have to hire labors to segregate post comsumption recycled materials to a finer degree.
So based on the above three reasons, there is a huge problem and there is a huge scope for the development of a tool that can automatically sort waste and educate people at the same time too.
Our vision and solution:
The problem which our solution aims to solve is “The lack of a tool to segregate waste”. Thus based on the above problem the vision for our “To develop a smart system that can help segregate waste for customers”.
Initial proposal:
Initially, we thought of developing a system that can classify waste from different areas of inputs such as houses, industries, restaurants, etc. This was a very wide domain area and there was ample potential to collect a lot of data, but given the time constraint and the data collection pace, we felt it will be difficult to obtain meaningful results in the given time frame. Also the waste images collected from such sources are not pure, as they are mixed with several other wastes. We have approached a food waste composting startup based in Pittsburgh and Guangzhou for the same, but the above mentioned reasons held us back.
Current scope:
We decided to focus on a specific restaurant in Pittsburgh, called Sushi Fuku. This is a local restaurant based in Oakland near Carnegie Mellon University.
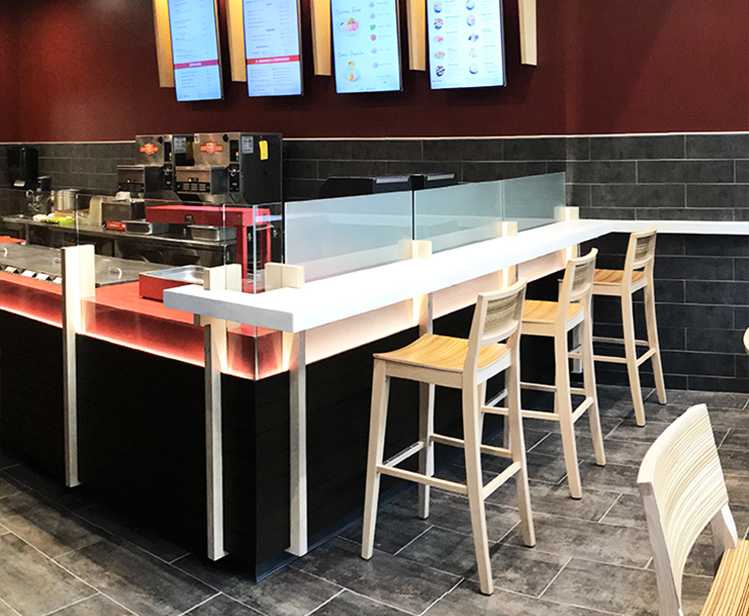
This restaurant mainly sells sushi, poke bowls and sushi wraps. The reasons for choosing Sushi Fuku are,
- Large amount of data available
- Limited categories of waste
- Easily accessible
- Easily categorizable
- Model can be scaled to other restaurants
Since there is a large student population, there is more waste generated. Since the restaurant only serves sushi and wraps the waste generated is mostly bowls, foils and plates. These classes are limited in number and can be easily categorized.
The primary beneficiary through the use of the system is the restaurant Sushi Fuku. As they will be better able to recycle waste and gain carbon credits for the same. There are recently introduced government policies which are promoting waste recycling. This claim is from a conversation with Mr. Chirag Patel of EY company.
The secondary beneficiary would be the municipal authorities. As they will have less burden in waste segregation and they can better recycle wastes. And these cost savings can be passed down to customers in the form of tax savings.
The tertiary beneficiary would be the society as a whole as there will be less waste dumped into landfills and more of it would be recycled. Thus there would be a cleaner and greener planet.
Initial Exploration
We started to explore the waste classification project to figure out the data we need to collect and the model that we need to use to solve this problem. We found one project by Collin Ching that showed the work of building an image classifier that can categorize different post-consumption waste. This project used ResNet-34 to train a dataset of 2533 images labeled in 6 categories: cardboard, glass, metal, paper, plastic, and trash. We decided to adopt the framework from this project because our problems are similar.
Data Collection
To solve the problem for Sushi Fuku, we found the dataset we found online were not representative enough for our problem. We found that the wastes that Sushi Fuku customer produces are not in the dataset of Ching’s project. For example, we found that there are a lot of paper bowls produced by Sushi Fuku customers, but there is no similar image in the dataset we found.
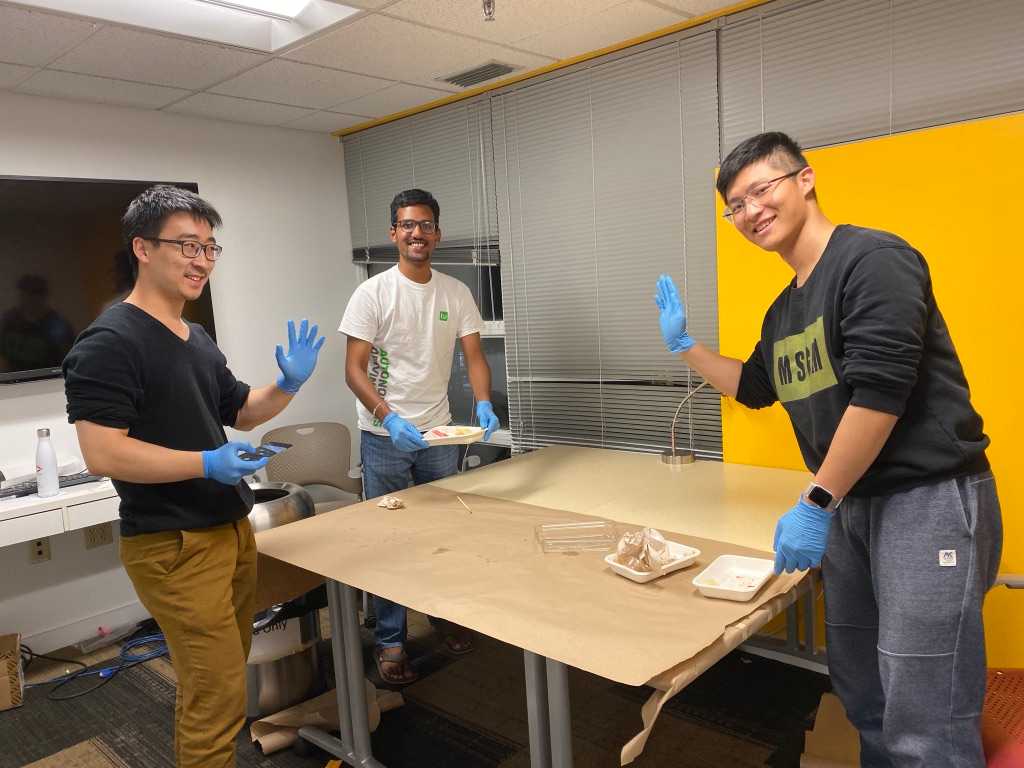
We decided to collect data by taking photos of wastes generated from Sushi Fuku customers. Having permission from Sushi Fuku, we took two bags of trash from them. By collecting the trash from the trash bag and taking photos of the trash, we managed to collect 543 pictures of different wastes.
Data Preparation
To prepare the data for training we first decided to resize our images into smaller sizes. One image size has an original size of 2736 by 2736 pixels to 512 by 512 pixels. A smaller sized image will help to run the algorithm faster. After that, we labeled our dataset manually into 16 categories:
- Tissue Paper
- Plastic Utensil
- Chopsticks
- Plastic Cover
- Sauce Packets
- Plastic Lid
- Chopstick Covers
- Paper Bowl
- Plastic Cup
- Food
- Straw
- Brown box
- Foil
- Paper Bowl Square
- Paper Bowl Small
- Sauce Cup
We then separate the dataset into the training set (49%), validation set (24%), and testing set (27%). It means that we have around 267 images for training and 135 images for validation and 141 images for testing. The images separated in a random way.
Model Selection and Training
We selected ResNet34 (He et al., 2016) as our pre-trained deep learning model for our problem. A pre-trained model performs well on a new dataset because the model already captures a lot of features from previous training. ResNet is a deep residual learning model that won the first place of 2015 ILSVRC ImageNet image recognition competition with 152 layers. Here, a residual represents the offsets between actual versus prediction.

Fig 2. What is a residual
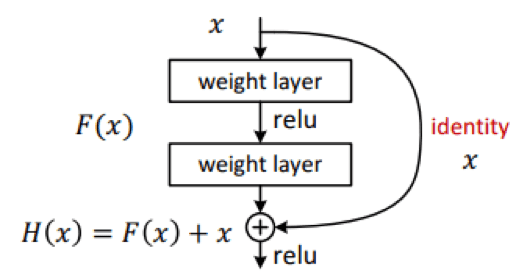
Fig 3: Shortcut connection in ResNet
By feedforwarding the identity across layers by establishing shortcut connections. This allows the model to grow deeper without degradation in accuracy. It also learns the residuals so that the predictions can be as close to actuals as possible. Here we used a ResNet with 34 layers to reduce the run time of the algorithm.
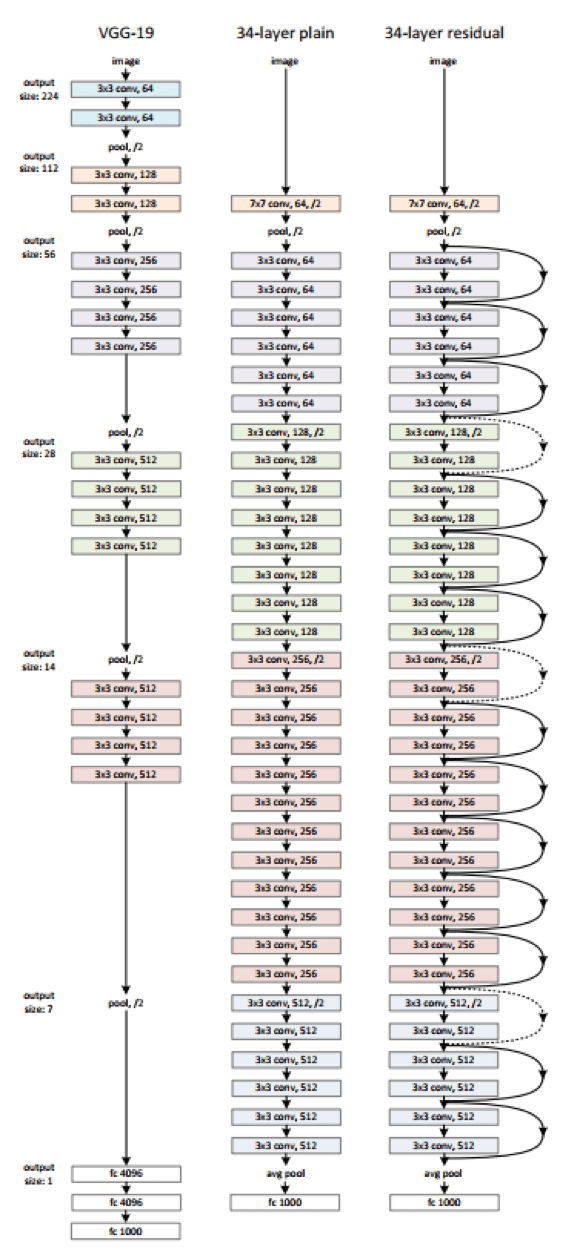
Fig 3: ResNet 34 architecture
Result Analysis
Fig 4: Confusion Matrix of prediction on testing set
The model developed got an accuracy of 95.74%. The model got most of the categories correct, but there were a few instances in which it got confused such as plastic lid and straw. This may be caused by the similar color between the two categories. There is one instance where square paper bowl and tissue paper are mis-categorized. This may be due to their similar color or there was tissue in the square paper bowl. Plastic lid and cup are mis-categorized, probably caused by the size and shape similarity.
Some prediction cases are missing because we had a small dataset. The test samples are not selected during the data splitting process. Thus, we missed the information of the prediction accuracy in these categories such as straw and small paper bowl.
At first glance, we had a very good result from our model. However, there is a possibility of overfitting the dataset because of the small data volume. Increasing the training data size and testing data size is the main issue that we need to solve in the next step.
Mock-up / Design:
We plan to use a kiosk to solve the problem. The machine has five parts: body, waste bins, LED screen, CPU and a camera. Our goal is to use the machine to assist customers to segregate waste into the right category so that the waste can be reused in generating more profit and saving more resources. Moreover, it would help people to establish the awareness of sorting waste and make a small step towards civilization.

Fig 5: SmartSort kiosk
The work flow of the machine has the following six steps:

Fig 6: Working flow of the machine
- Customers’ pressing the button to initialize waste sort.
- Set the waste on the designated place (red platform).
- The camera scans the waste using the aforementioned computer vision technology.
- The interface shows the detail information of the waste and classified them into three categories: compostable waste, recyclable waste and other trash. The users could put different kinds of waste into the right waste bin following the instructions on the screen.
- There are three LED lights close to the mouth of each waste bin. The light indicates the unfinished categorization works. Once all wastes are categorized, the light will turn off.
- The last step is to sort waste following the instructions on the screen.
So the machine is designed to assist the user in waste segregation. Once the user has sufficient knowledge in this aspect, they can do the waste disposal manually, if desired. In the future when the machine can sort waste automatically without any assistance from users, there will not be a need of the button because the user could just put the waste on the designated place and leave. And the above mentioned situation of the user pressing buttons to activate the machine would not happen.
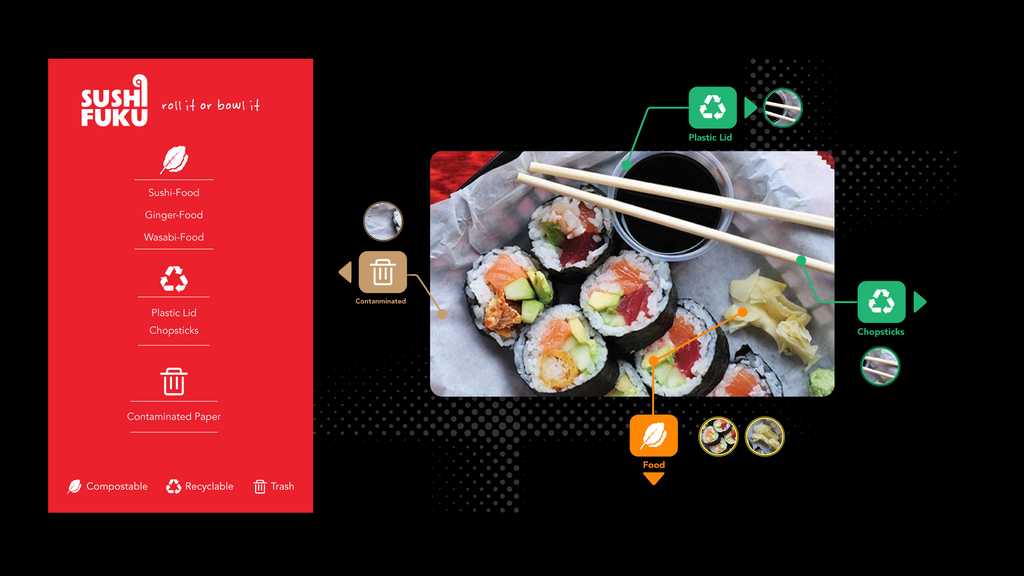
Fig 7: User interface
Future Work
A few points which we would like to address in future versions of our product are:
- Compare the problem to classify wastes in all restaurants Since the waste generated from restaurants is generally similar. The major waste categories would still remain the same. So with a few minor changes this model can be applied to other restaurants.
- Recognize objects with mixed data types The model is currently trained with data containing pure data, i.e. the images do not contain mixed waste. So in the later stages we would like to train and test the model with mixed waste data (ex: plastic and food mixed; wood and metal mixed, etc.). This data is more commonly found in household and industrial sites.
- Add 2nd level of classification This 2nd level of classification is mainly intended for localizing the waste segregation to comply with the local community needs.
- Prototype and test the model in a real scenario This stage involves developing a physical device that can work in the real life scenario. To begin with we would start with Sushi Fuku, since it was our focus restaurant.
- Launch the product in market Last but not the least, we would like to market and launch this product in the market, once the product features and capabilities have been upgraded to satisfy customer needs across various domains.
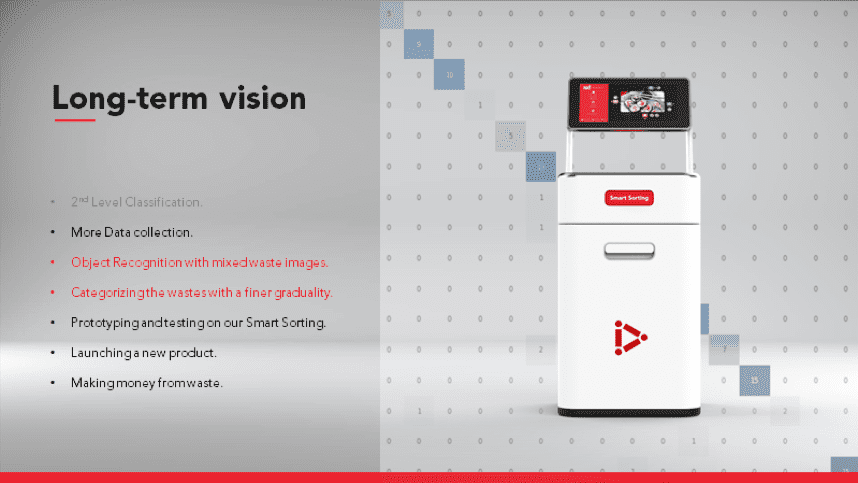
Fig 8: Long-term vision
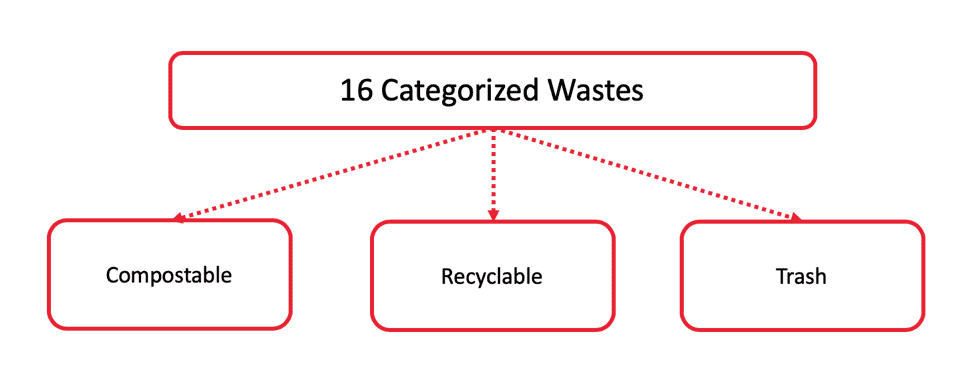
Fig 9: Main categories
The above image details how we would like to broadly classify the waste for segregation for current stage. While training the model we used separate categories for the various products in each of the three broad categories because different products have different visual elements and all of them cannot be grouped together as we think that will confuse the model. However, we need to look more into the features of the wastes and continue to simplify the labels in the future.
Ex: plastic cup and aluminium foil both fall under the broad category of “Recyclable Waste”, but each of these two products have different visual features. If both of these products are grouped into the same category, then the model will get confused and not classify the data properly. Hence we used separate categories and then group them together.
References
- Country wise waste segregation data figure https://www.forbes.com/sites/niallmccarthy/2016/03/04/the-countries-winning-the-recycling-race-infographic/#4cccb65b2b3d
- Collin Ching, “How to build an image classifier for waste sorting” https://towardsdatascience.com/how-to-build-an-image-classifier-for-waste-sorting-6d11d3c9c478
- Anand Saha: “Decoding Restnet Architecture” http://teleported.in/posts/decoding-resnet-architecture/
- He, Kaiming, et al. "Deep residual learning for image recognition." Proceedings of the IEEE conference on comp
Team
- Arthur Cen
- Tim Yan
- Varun Yalamanchi